Is your ETF income sustainable?

Track dividends, NAV erosion and concentration across your covered-call and income ETFs. Ask Scout what the signals mean for your portfolio.

Start your 14-day free trial
Card required. Cancel anytime before day 14.
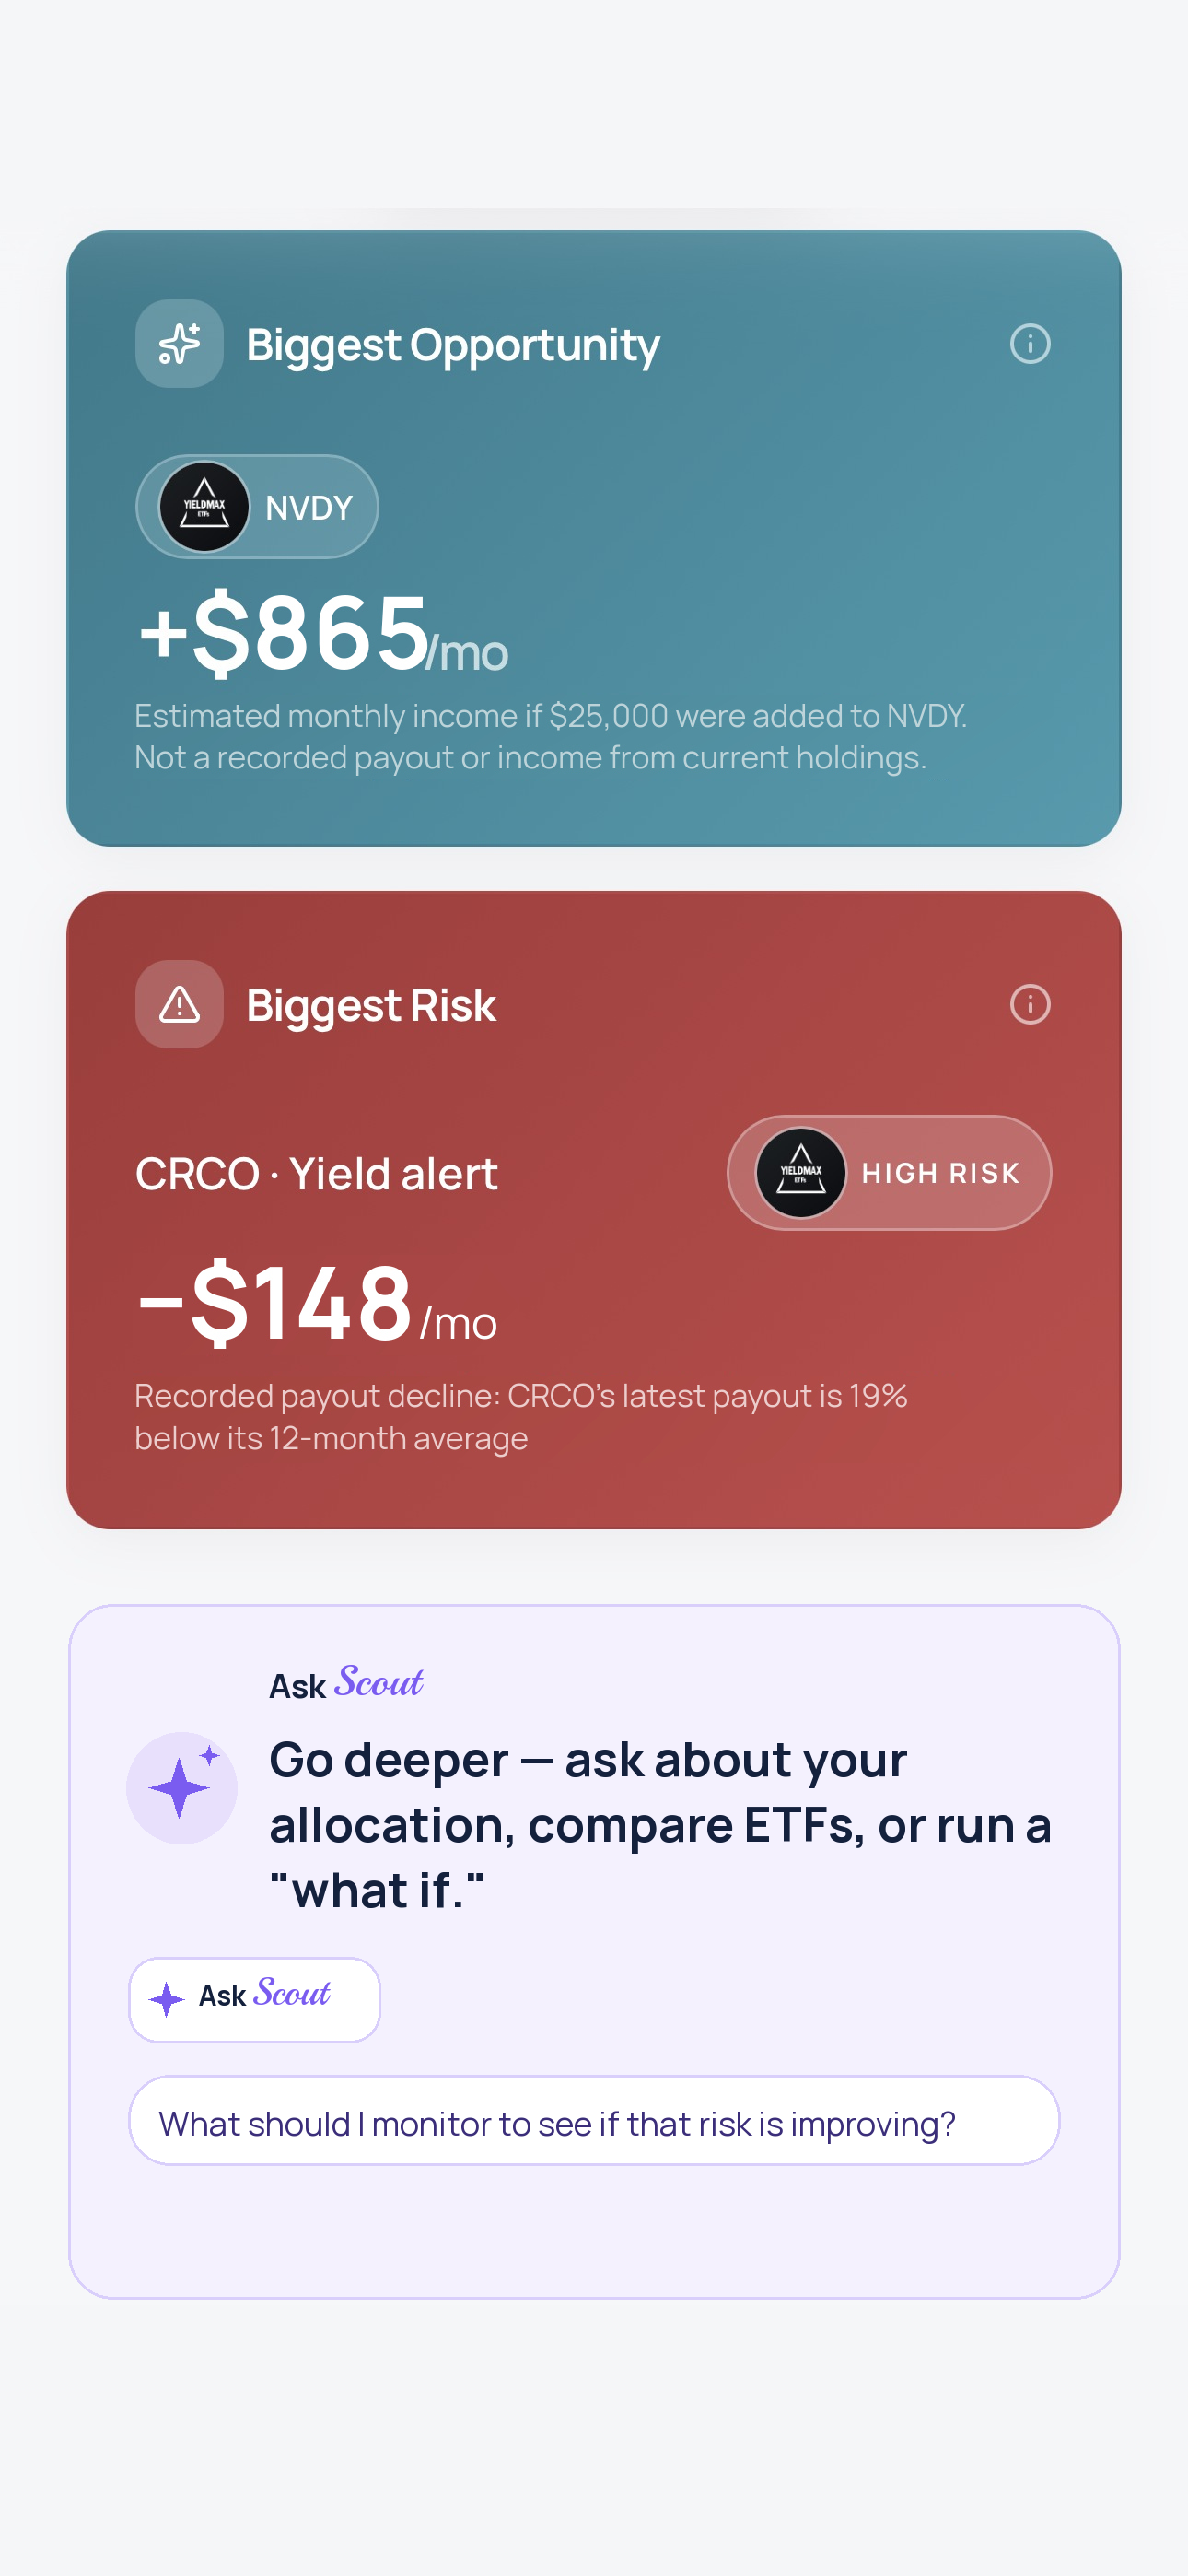
Portfolio Intelligence showing Biggest Opportunity, Biggest Risk, and Ask Scout
01 · Portfolio Intelligence & Alerts

Know your biggest risk and opportunity

plus alerts when payouts increase or drop

Sample data
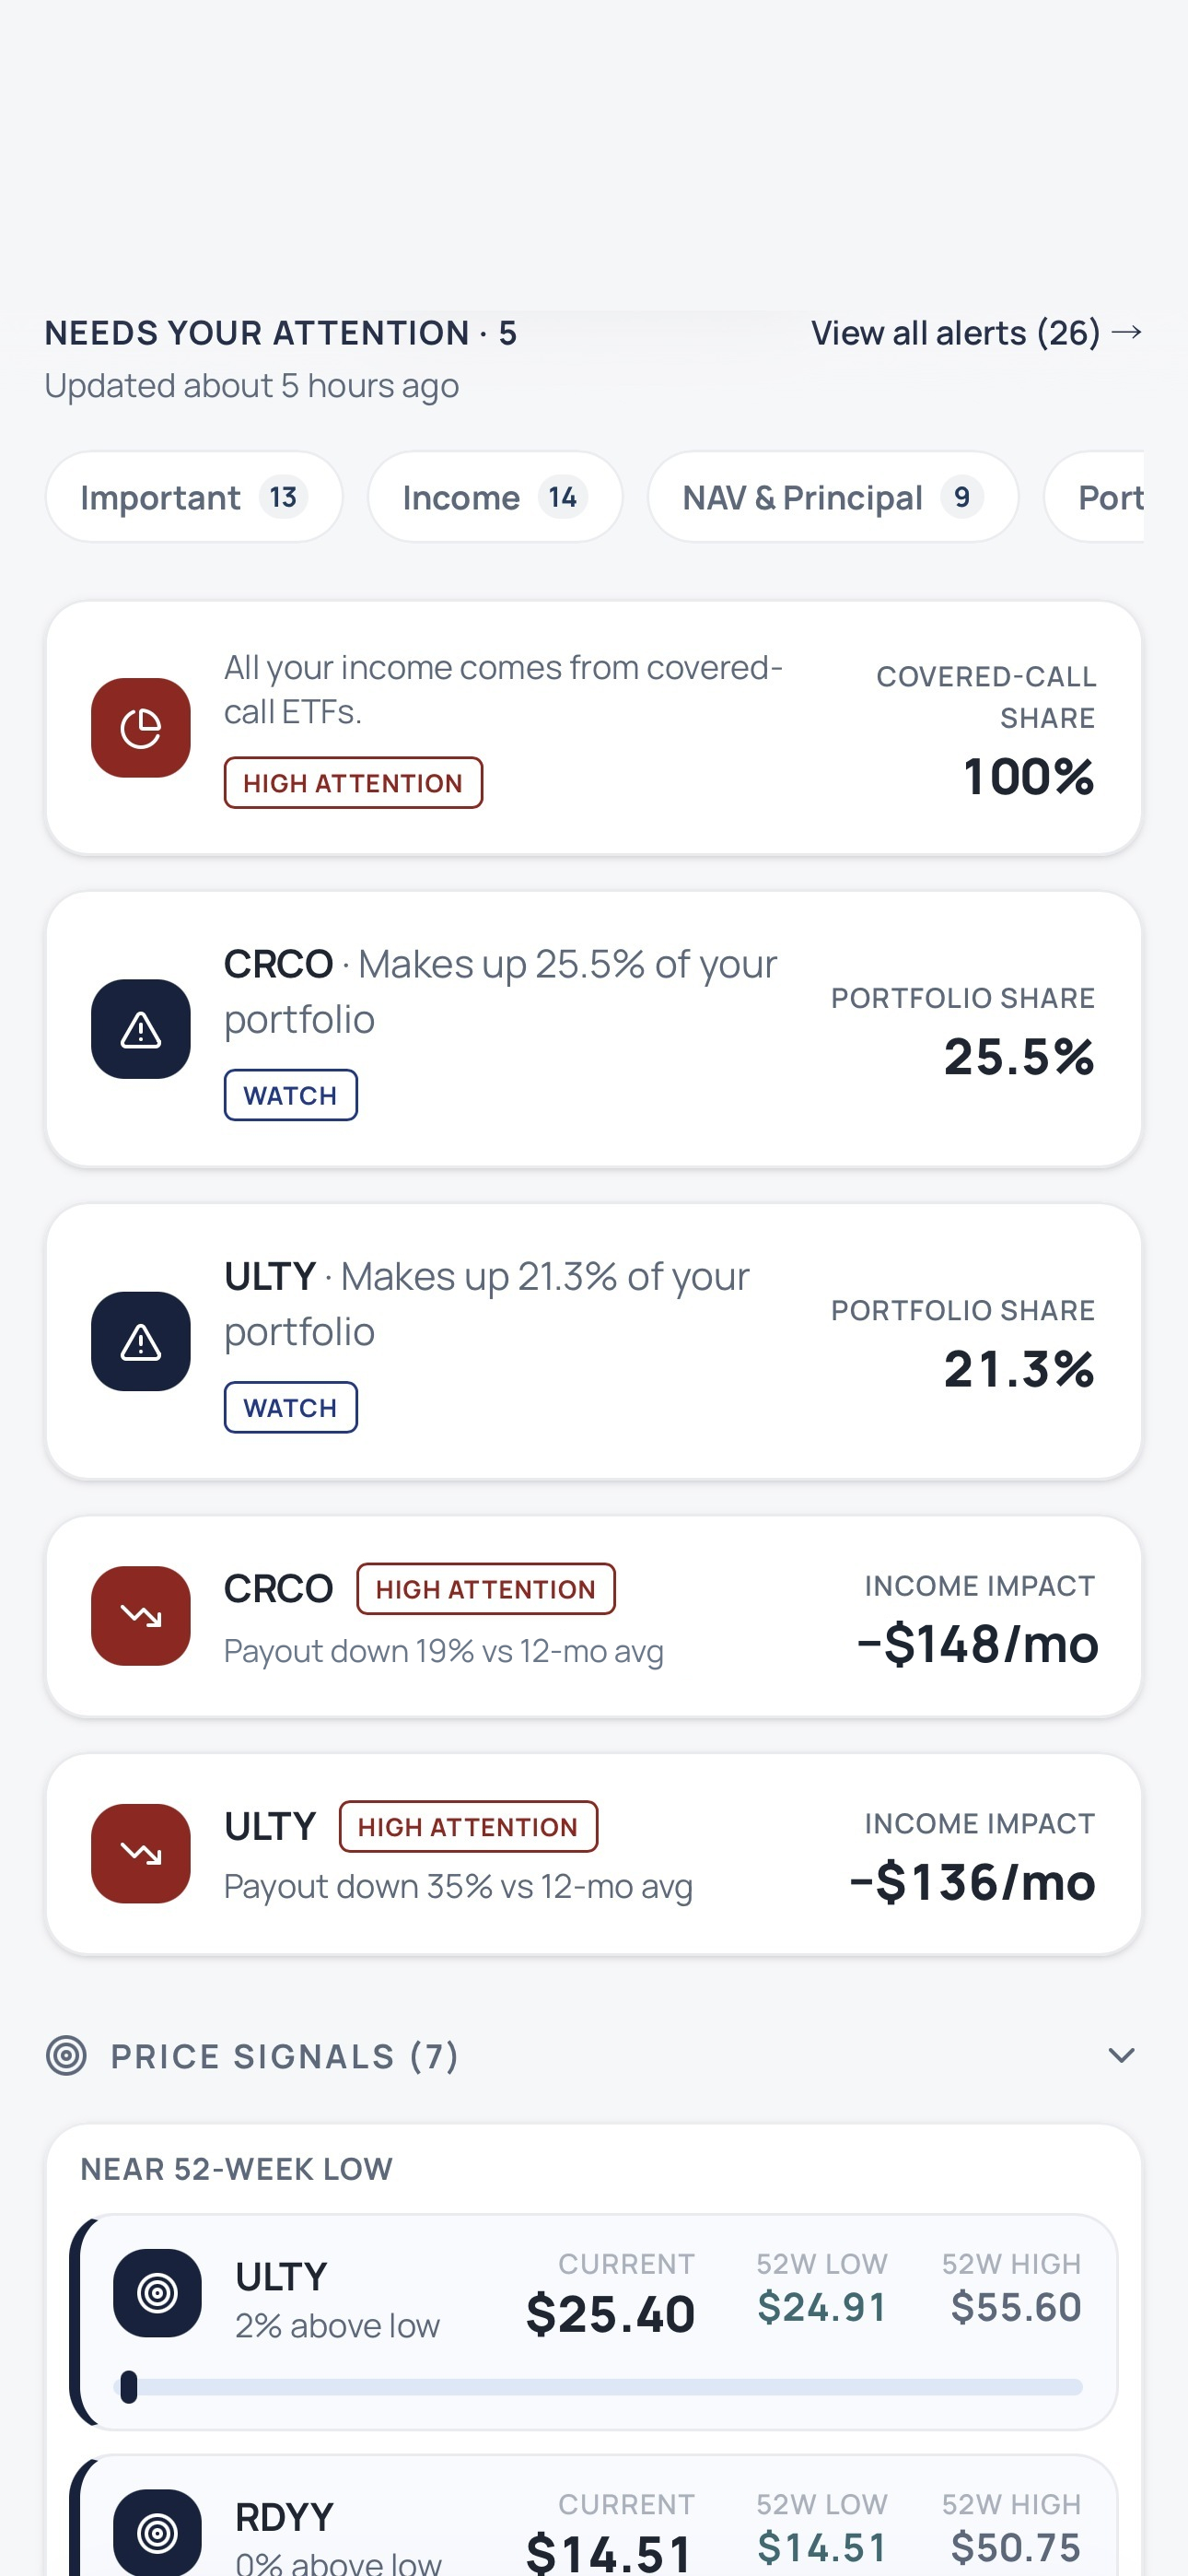
Portfolio Intelligence showing Biggest Opportunity, Biggest Risk, and Ask Scout
Alerts showing covered-call concentration, portfolio share, and payout drops
02 · Rebalancing scenarios

See what a different mix could pay.

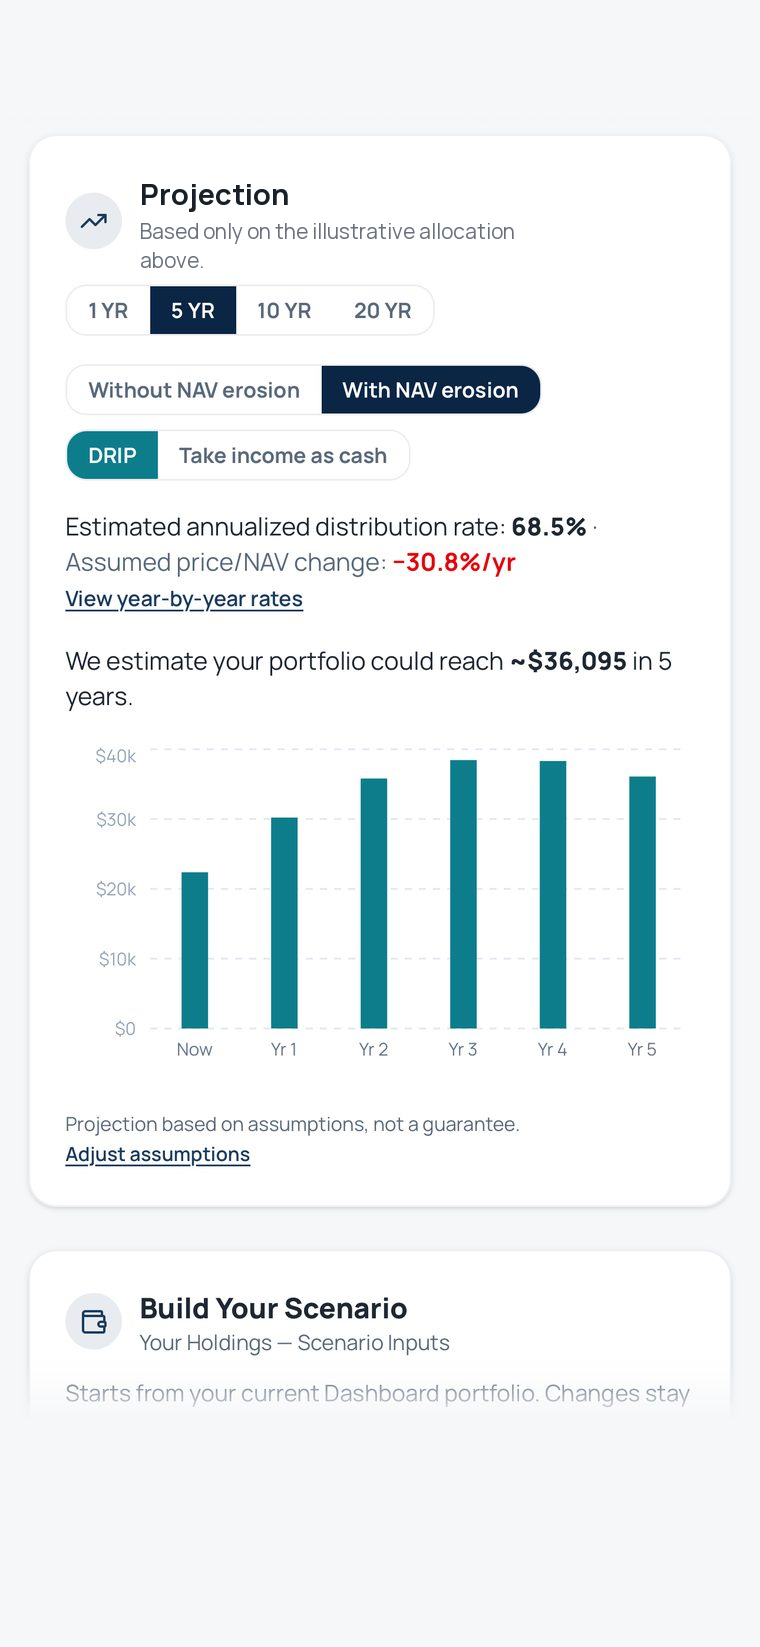
Compare possible ETF allocations, projected monthly income, and the tradeoffs behind each scenario. Your holdings won't change.

Sample data
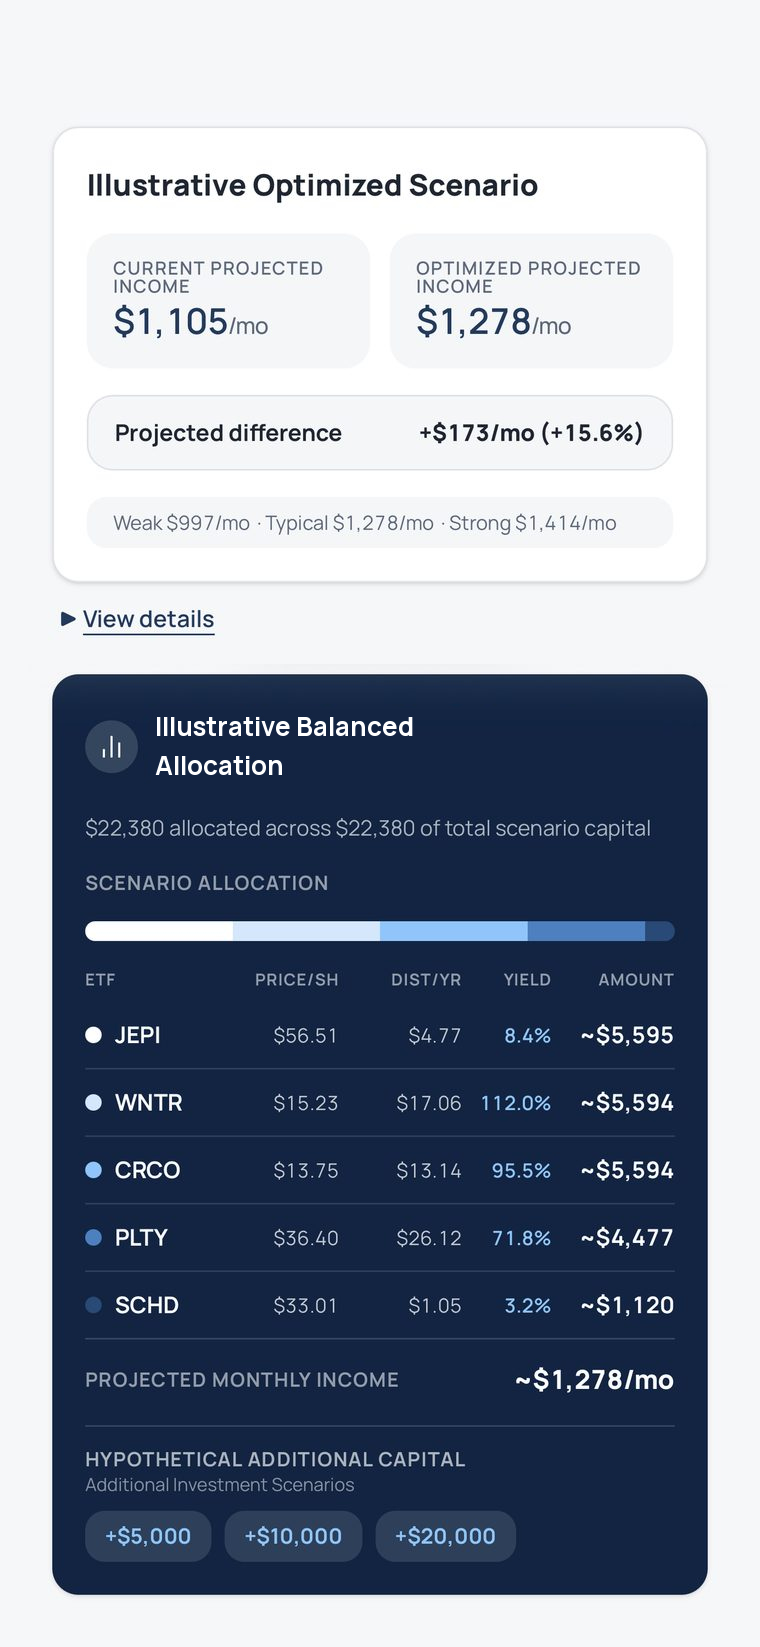
Illustrative Scenario comparing projected income of $1,105 and $1,278 per month
ETF WIT five-year income projection with NAV erosion
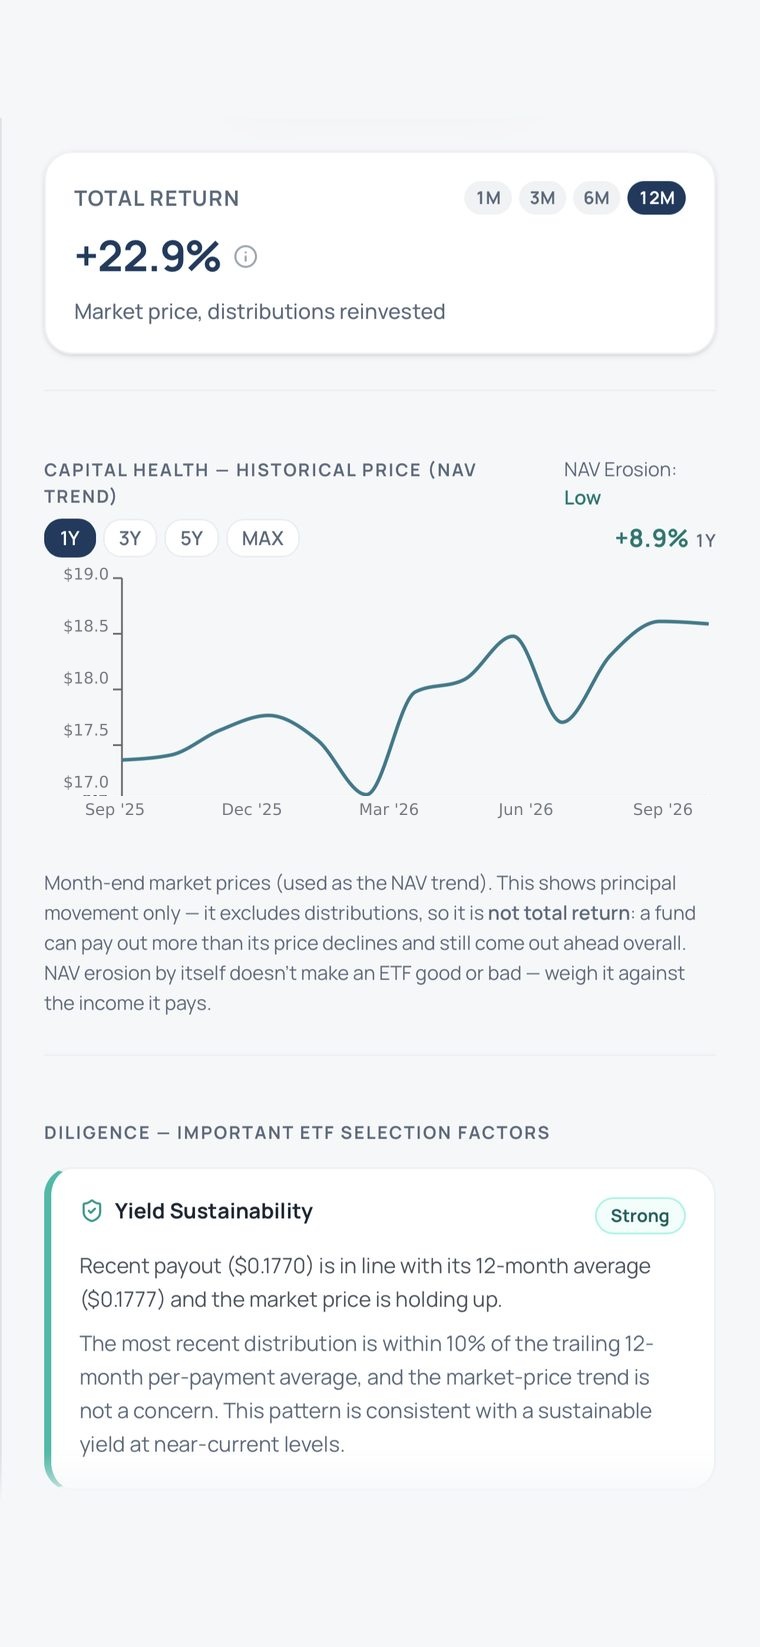
03 · Explore Investments

Look under the hood of an income ETF.

Compare an ETF's distributions, price history, and total return, not just its headline yield.

Sample data
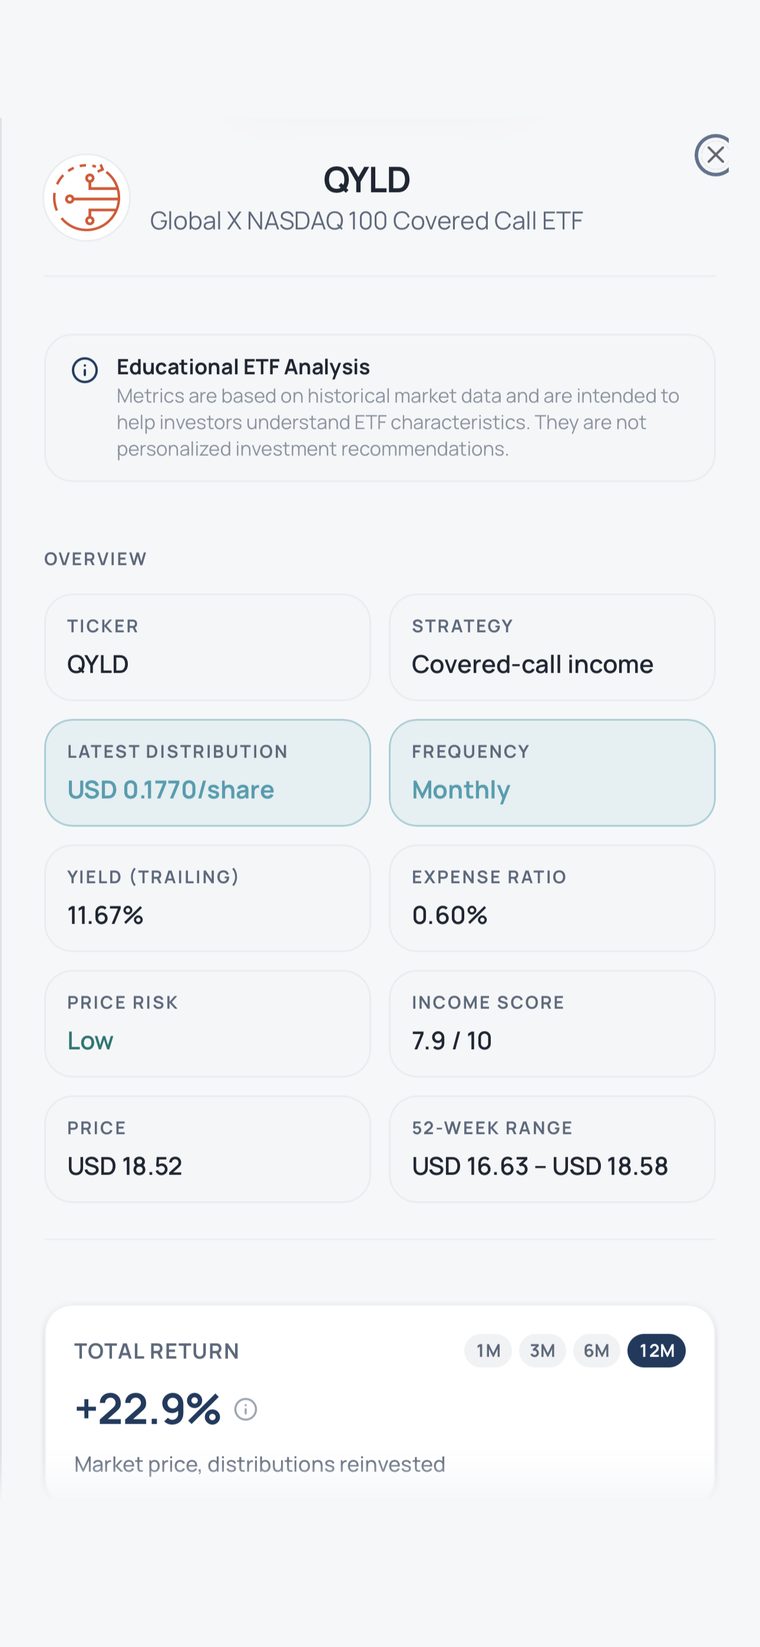
QYLD ETF overview with strategy, distribution, yield and expense ratio
QYLD total return, price history and payout sustainability rating
Start your 14-day free trial
Card required. Cancel anytime before day 14.

Start with 14 days free

Explore all Premium features. Card required. Cancel anytime before day 14.

Checking offer availability…

Understand your ETF risks

Look beyond headline yield. Learn how payouts, total return, and NAV changes affect your ETF income.

Estimating monthly ETF income →

Understand how changing payouts affect your monthly estimate.

Distribution yield vs. total return →

See how distributions and price changes contribute to total return.

Understanding NAV erosion →

Learn what a declining chart can—and cannot—tell you.

View all guides →